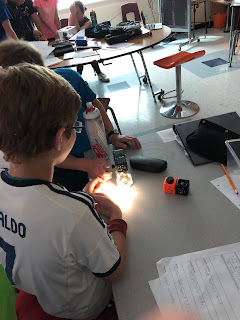
 Students worked in small groups to collect data from each of the eight silos, and recorded lengths of 40 oysters. When we returned to the classroom, students learned how to use Google Sheets to enter their data, find the =sum and the
=average of their data sets. Then, they learned how to generate graphs from their tables of data. This proved to be very challenging, but they handled this tremendously well and worked together so that everyone learned the basics of spreadsheets, and the importance of entering data correctly. :) These images are examples of student data tables and graphs.

Here are some images taken while students were working together measuring the oysters. They were very engaged and really taking their work seriously! A great day!
While one homeroom was busy at the upweller, the other homeroom was enjoying the beautiful outdoors with Mr. Hagerty at the other end of the landing.


